We are proud to have released the 2024 iteration of our Maintainability Model, now available to all Sigrid® customers.
Our Maintainability Model, certified by TüVIT and based on the ISO 25010 standard for software product quality, is updated annually to accommodate new technologies, frameworks, and tools.
This article explains why we do this yearly, gives some background information about its importance, and clarifies what it means when using Sigrid, our software assurance platform.
What is maintainability and why is it important for software development?
According to ISO 25010, the textbook definition of Maintainability is “The degree of effectiveness and efficiency with which a product or system can be modified by the intended maintainers”.
Think of a software system as your house. If it is built solid and right-angled, it’s easy to hang paintings, add a window or maybe even add an extension to it. You don’t have to reinforce anything or take crooked walls into account – because they’re simply straight and sturdy. Maintainability of your house is an indication of how easy it is to fix, improve, and understand. The same holds for your source code.
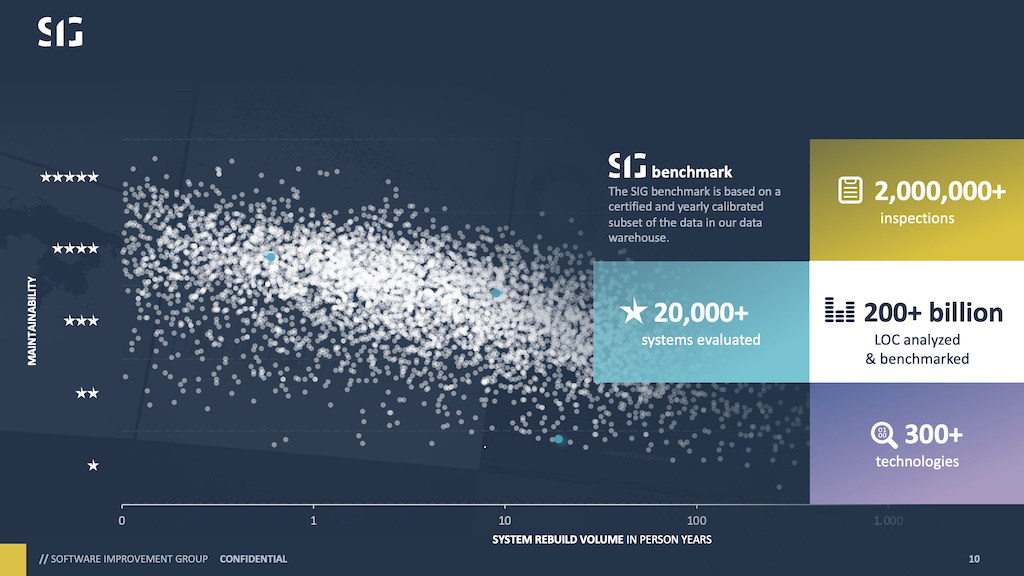
At SIG, we have a unique approach to software assurance and our maintainability model is vital to the actionable insights we provide. We thoroughly analyze our customers’ software portfolios by benchmarking their source code against the world’s largest code database which consists of over 200 billion lines of code across more than 18,000 systems and over 300 technologies.
Why do we benchmark?
You can read a lot more about this in our online documentation, but in a nutshell, to assess the quality of something, you need a sense of context. And each piece of software may have a widely different context. So, to put objective thresholds under code quality, we use technology-independent code measurements and compare those to a benchmark.
A benchmark on quality is meaningful because it shows you an unbiased norm of how well you are doing.
It provides a frame of reference, let’s use a simplified analogy of measuring temperature. Everyone will know what we mean by 20 or 200 degrees Celsius. And if it were 200 degrees outside, we would not debate the measurement scale, we’d be debating the challenges we have. Regardless of whether you are a weatherman, a scientist, or anyone else.
Understanding our maintainability model
The SIG benchmark provides a star rating between 1 and 5 stars, where 3 stars is the market average. This unique approach – that is, having a benchmark – benefits you in 4 different ways:
1. Comparison
Benchmarking allows you to compare your software’s quality against the broader market. Regardless of technology or domain, you see your performance: where you could improve and where you’re already hitting the mark. It shows what ‘good quality’ means and provides guidance as to what you could do to get there.
2. Objectivity
By comparing your system against a dataset comprising thousands of systems, the SIG benchmark provides an objective view of your software’s quality. This objectivity removes the guesswork from measuring quality, giving you clear insights into technical debt, maintenance impact, and agility.
3. Alignment
The benchmark facilitates alignment between development teams and management by offering a unified view of the data. This shared perspective helps focus efforts on what truly matters, ensuring everyone is working towards the same goals.
4. Governance and Execution
With objective data in hand, management can efficiently allocate resources while development teams can execute tasks effectively. This clarity also helps teams explain why certain tasks might take longer, based on the quantified impacts of the current software state.
Why do we update our maintainability model yearly?
The 2024 Maintainability Model update reflects the latest advancements in software quality standards, providing an objective and reliable frame of reference for assessing the build quality of your software systems.
As technology evolves, so must the tools and metrics we use to measure its quality.
As an analogy, let’s go back to our house. Imagine comparing the standards of a house built in the 1930s with one that was built in 2024: While the 1930s house was good at the time, by now, that same house is heavily dated against current standards.
Maintenance requires effort. Even if you don’t change much, the world moves on and we need to keep up with it while it does. This is not taken lightly: TüVIT, the international leader in providing independent audits and certifications, checks every step we take, year after year.
Recently, the 2024 iteration of our Maintainability Model of the ISO25010 Maintainability standard got certified, ensuring that our benchmark remains relevant and accurately reflects the current state of software development. In addition, our customers will continue to benefit from the most comprehensive and latest insights to govern their software development.
How do you benefit from our new maintainability model in Sigrid®?
Taking this one step further, it’s not just the access to the latest insights that help and guide. It’s the interpretation of it and the translation into actionable goals.
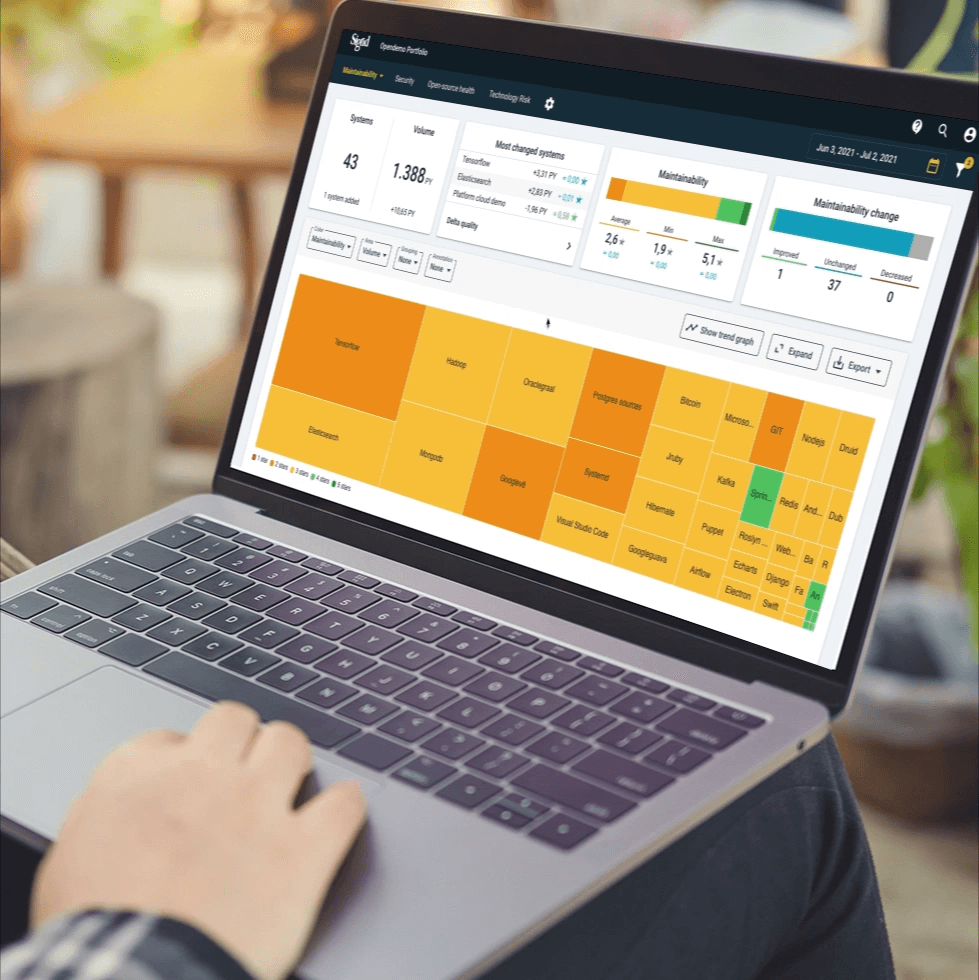
This is where Sigrid, our software assurance platform, comes in.
With it, you can pinpoint the most critical maintainability initiatives your business should pursue. And as of today, these insights will be based on our latest maintainability model.
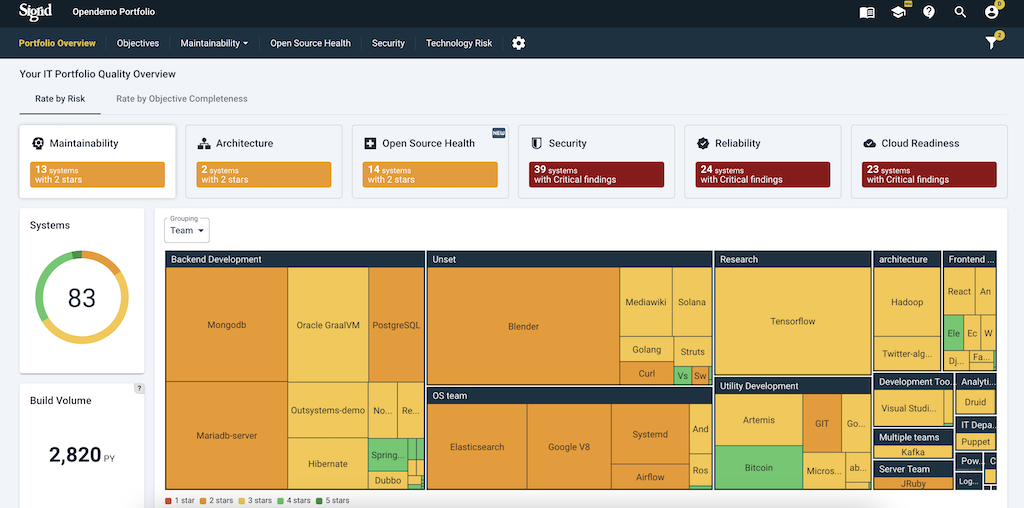
Sigrid not only assesses maintainability but also leads in improving the quality and mitigating risks across your software portfolio. It has renowned models and features in place to optimize the security, architecture, and open-source libraries across your entire portfolio.
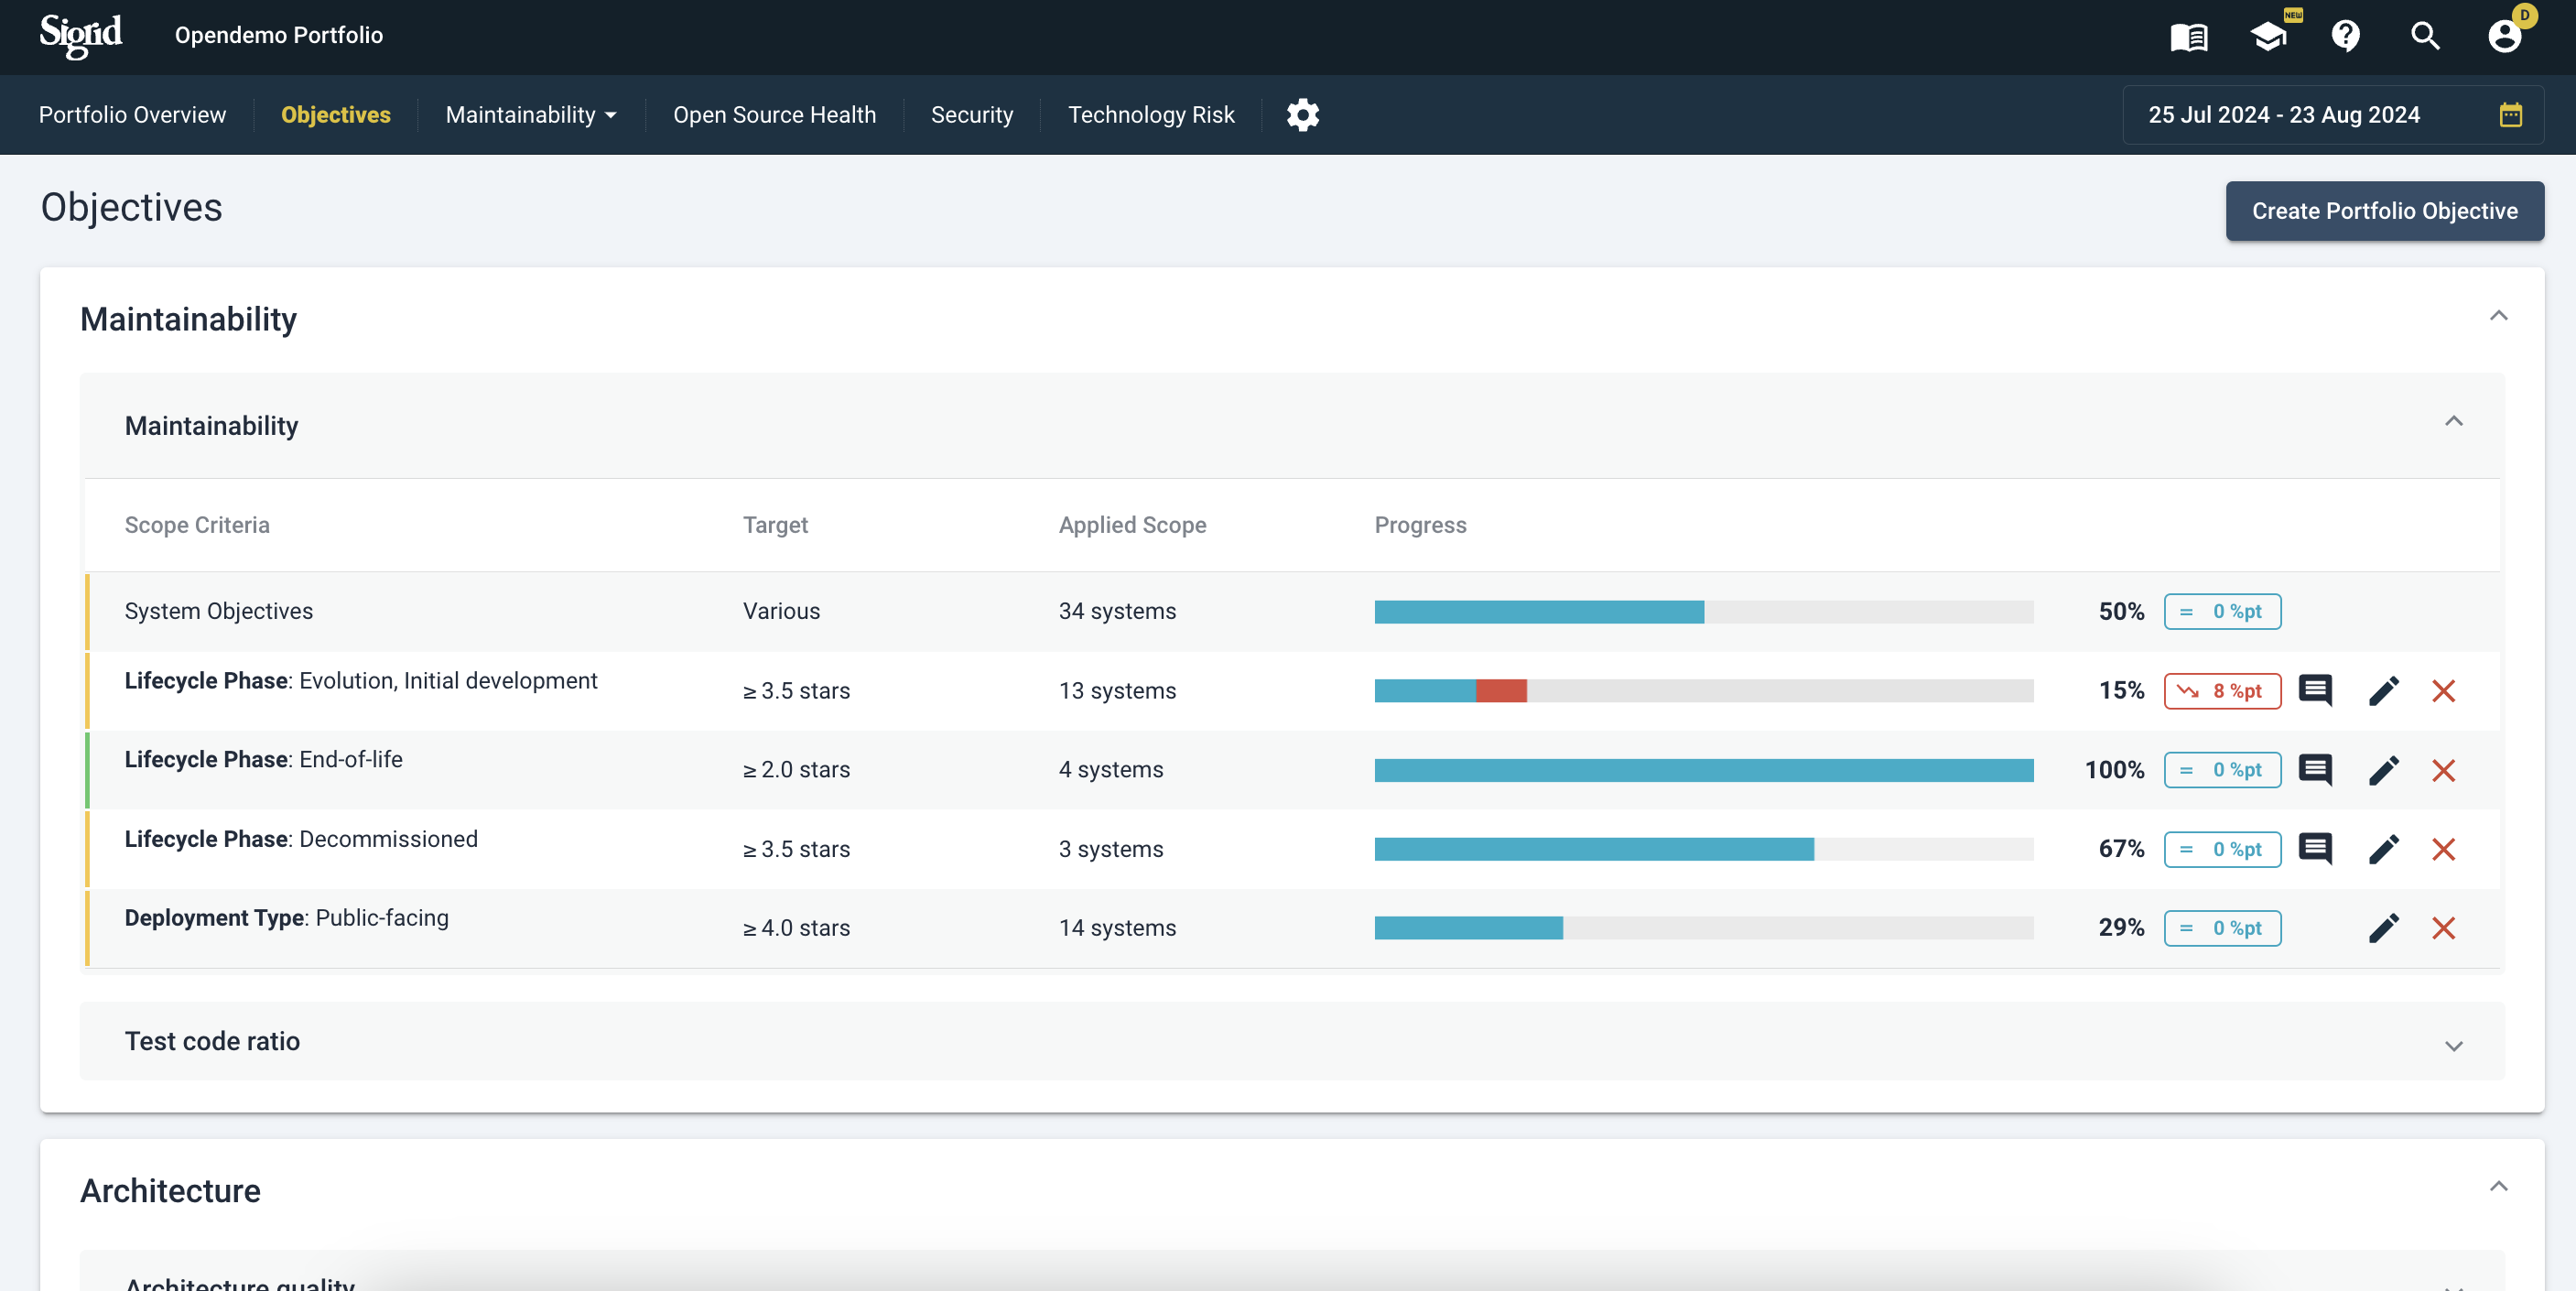
Our platform delivers prioritized recommendations and acts as a single source of truth for all relevant stakeholders; As a manager, you can set objectives on quality and monitor them; as a developer, you use the code explorer to find risks per file or function and use the advice the platform provides to mend these.
To return to our house analogy: you may not be a constructor, so it is helpful to have expert insight and advice when trying to keep your house from leaking or adding an extension. You can see Sigrid as your digital assistant. She does not decide for you, but she points you in the right direction. She provides you with the tools to understand, prioritize and mitigate challenges and risks along the way.
Want to know more?
You can find more information about our platform and IT consulting services on our website.