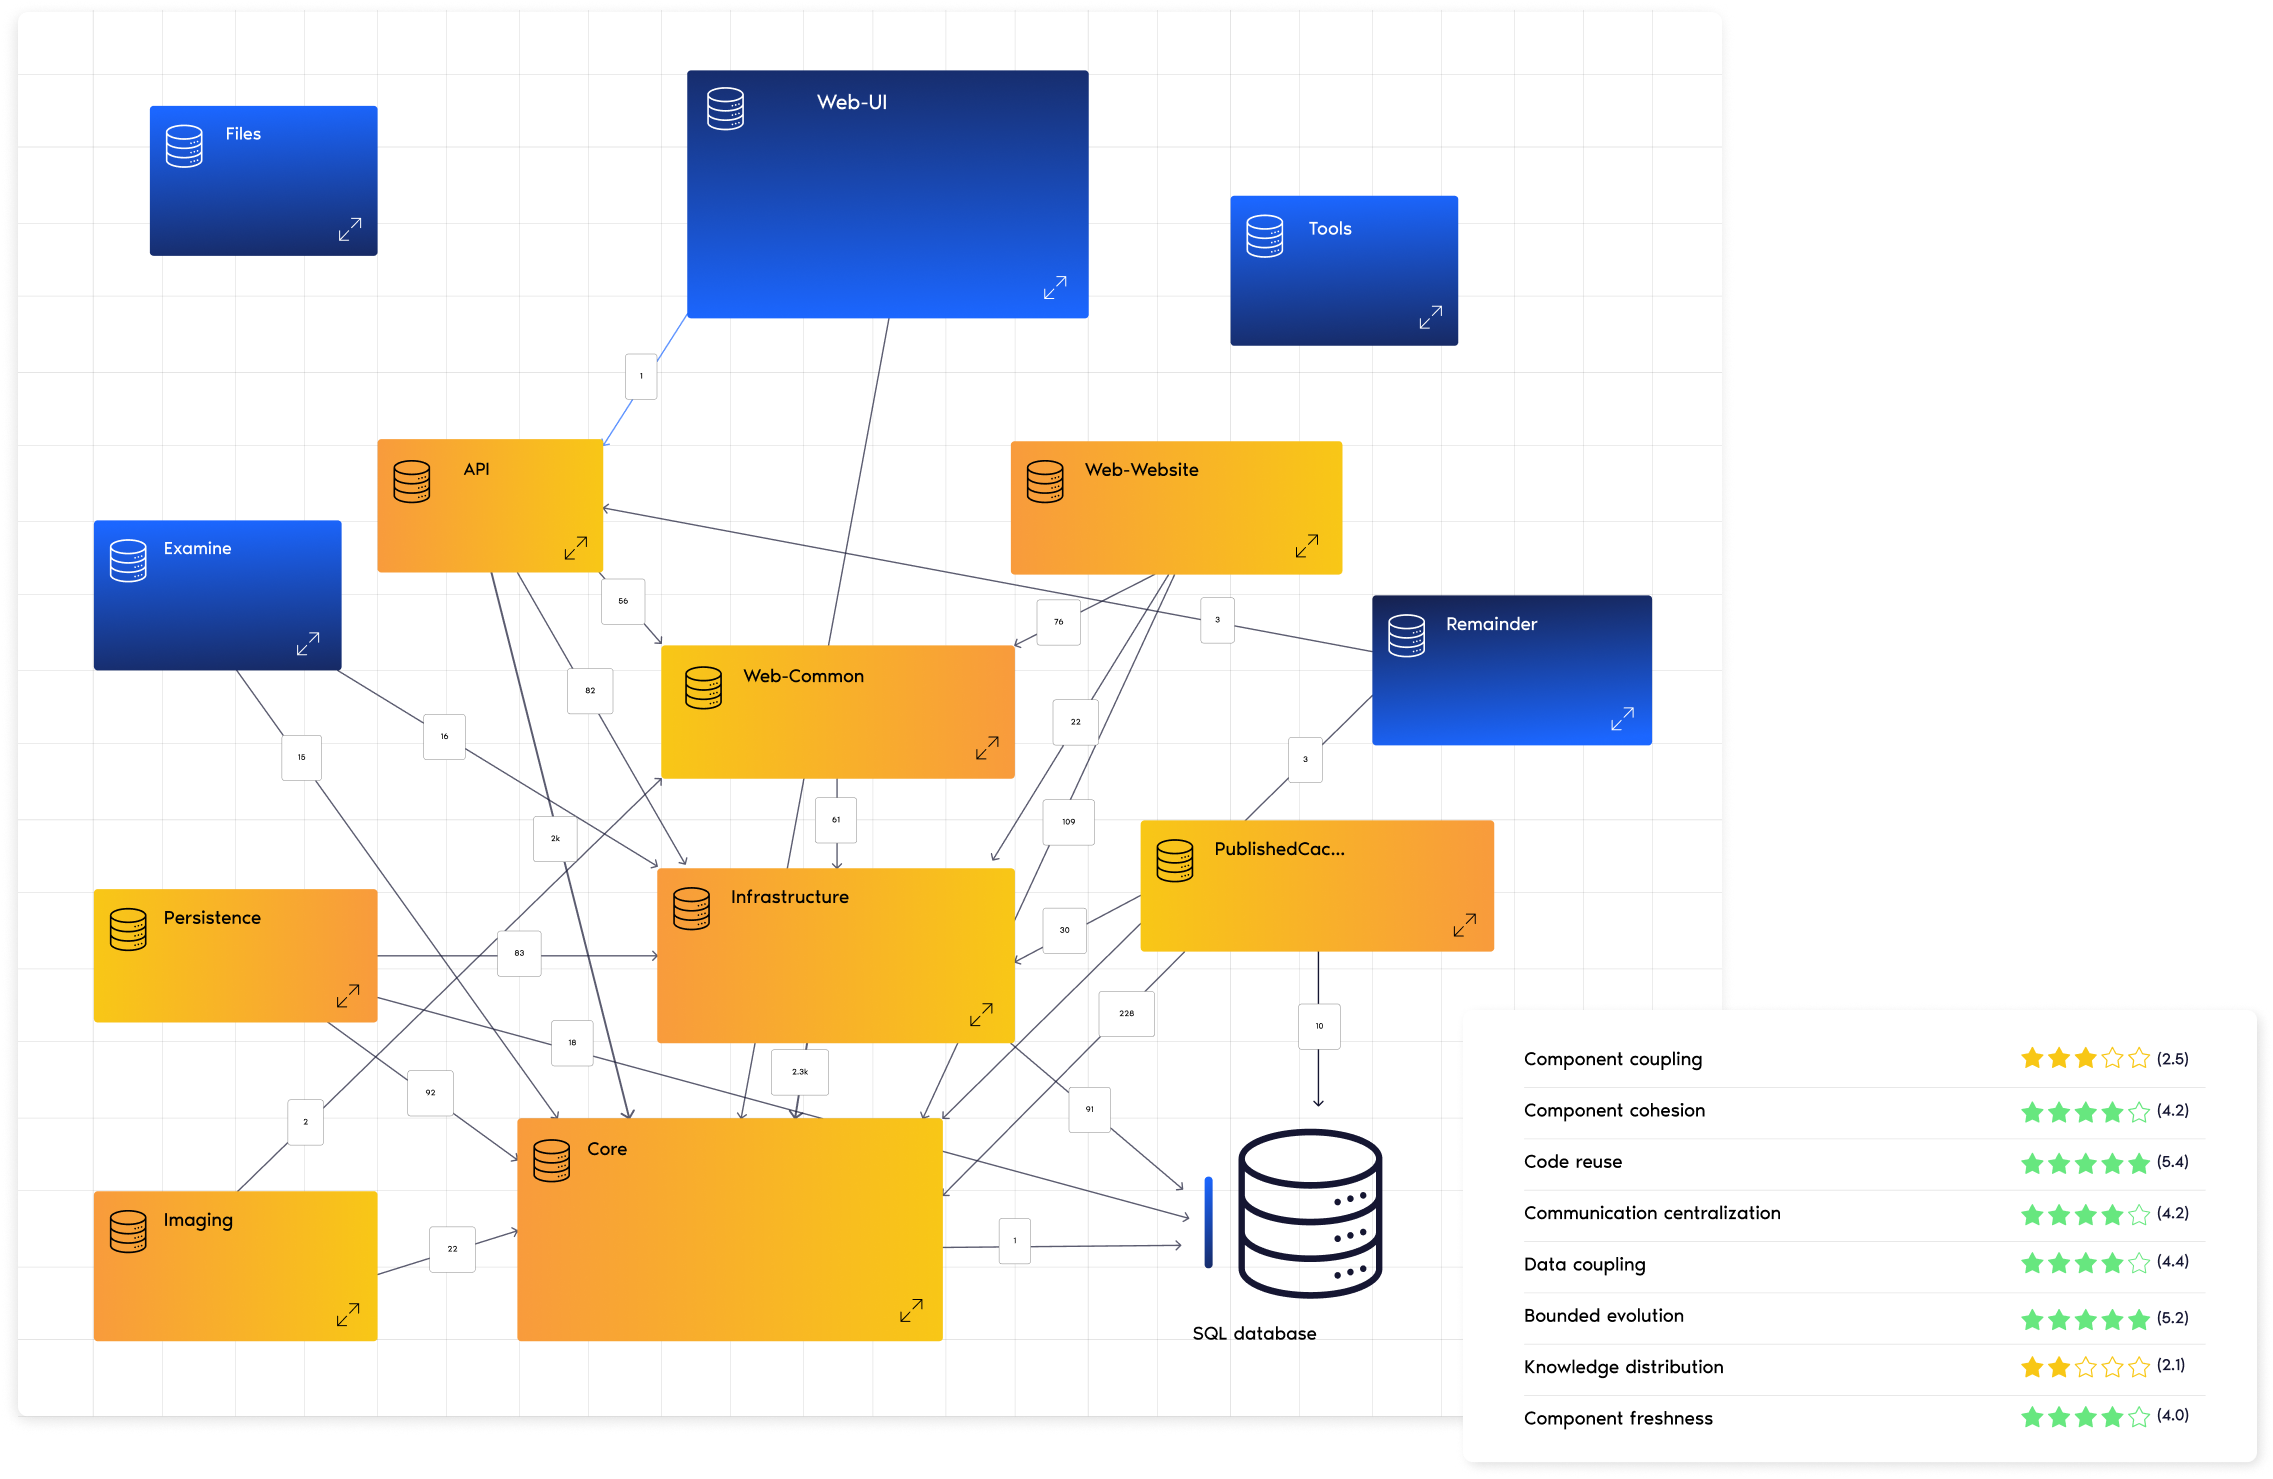
Download the Software Portfolio Scan report

Get a preview of the Software Portfolio Scan: an in-depth report on your IT health, benchmarked against industry standards. The report identifies risks and provides actionable steps to enhance productivity while ensuring future-readiness.

*This sample report is illustrated through Horizon United, a hypothetical business facing real-world IT challenges.

Name*
Privacy*
This field is for validation purposes and should be left unchanged.

Example insights from the Portfolio Scan:

Yellow circles graphic

+50%

of maintenance costs due to outdated technology.

Yellow circles graphic

$8.3M

potential savings per year by phasing out COBOL.

Yellow circles graphic

30%

delay in system changes from rigid architecture.

Yellow circles graphic

22.7M

worth of technical debt accrued in yearly maintenance costs.

The report includes:

01
Executive summary for the boardroom
Fast, actionable recommendations on security, productivity, and architecture. All in one page.
02
Deep dive 1: Cost efficiency
Learn which costs are holding the client back – from technical debt to outdated technologies they should better phase out.
03
Deep dive 2: Producitvity
Which systems are roadblocks to efficiency? How can they improve development speed and reduce time to market?
04
Deep dive 3: Security
Open-source management gaps are creating vulnerabilities​, even if the overall security score is above the industry benchmark.
05
Deep dive 4: Future-proofness
While the software portfolio architecture seems to be above average, scalability is a problem – a limit to fully become AI-ready.

The Software Portfolio Scan is your IT competitive advantage

Actionable insights in just 2 weeks

Security, productivity, and architecture analysis with fast, actionable recommendations.​

IT benchmark for your industry

Benchmark your IT portfolio against industry peers to see how you compare to competitors–are you ahead?
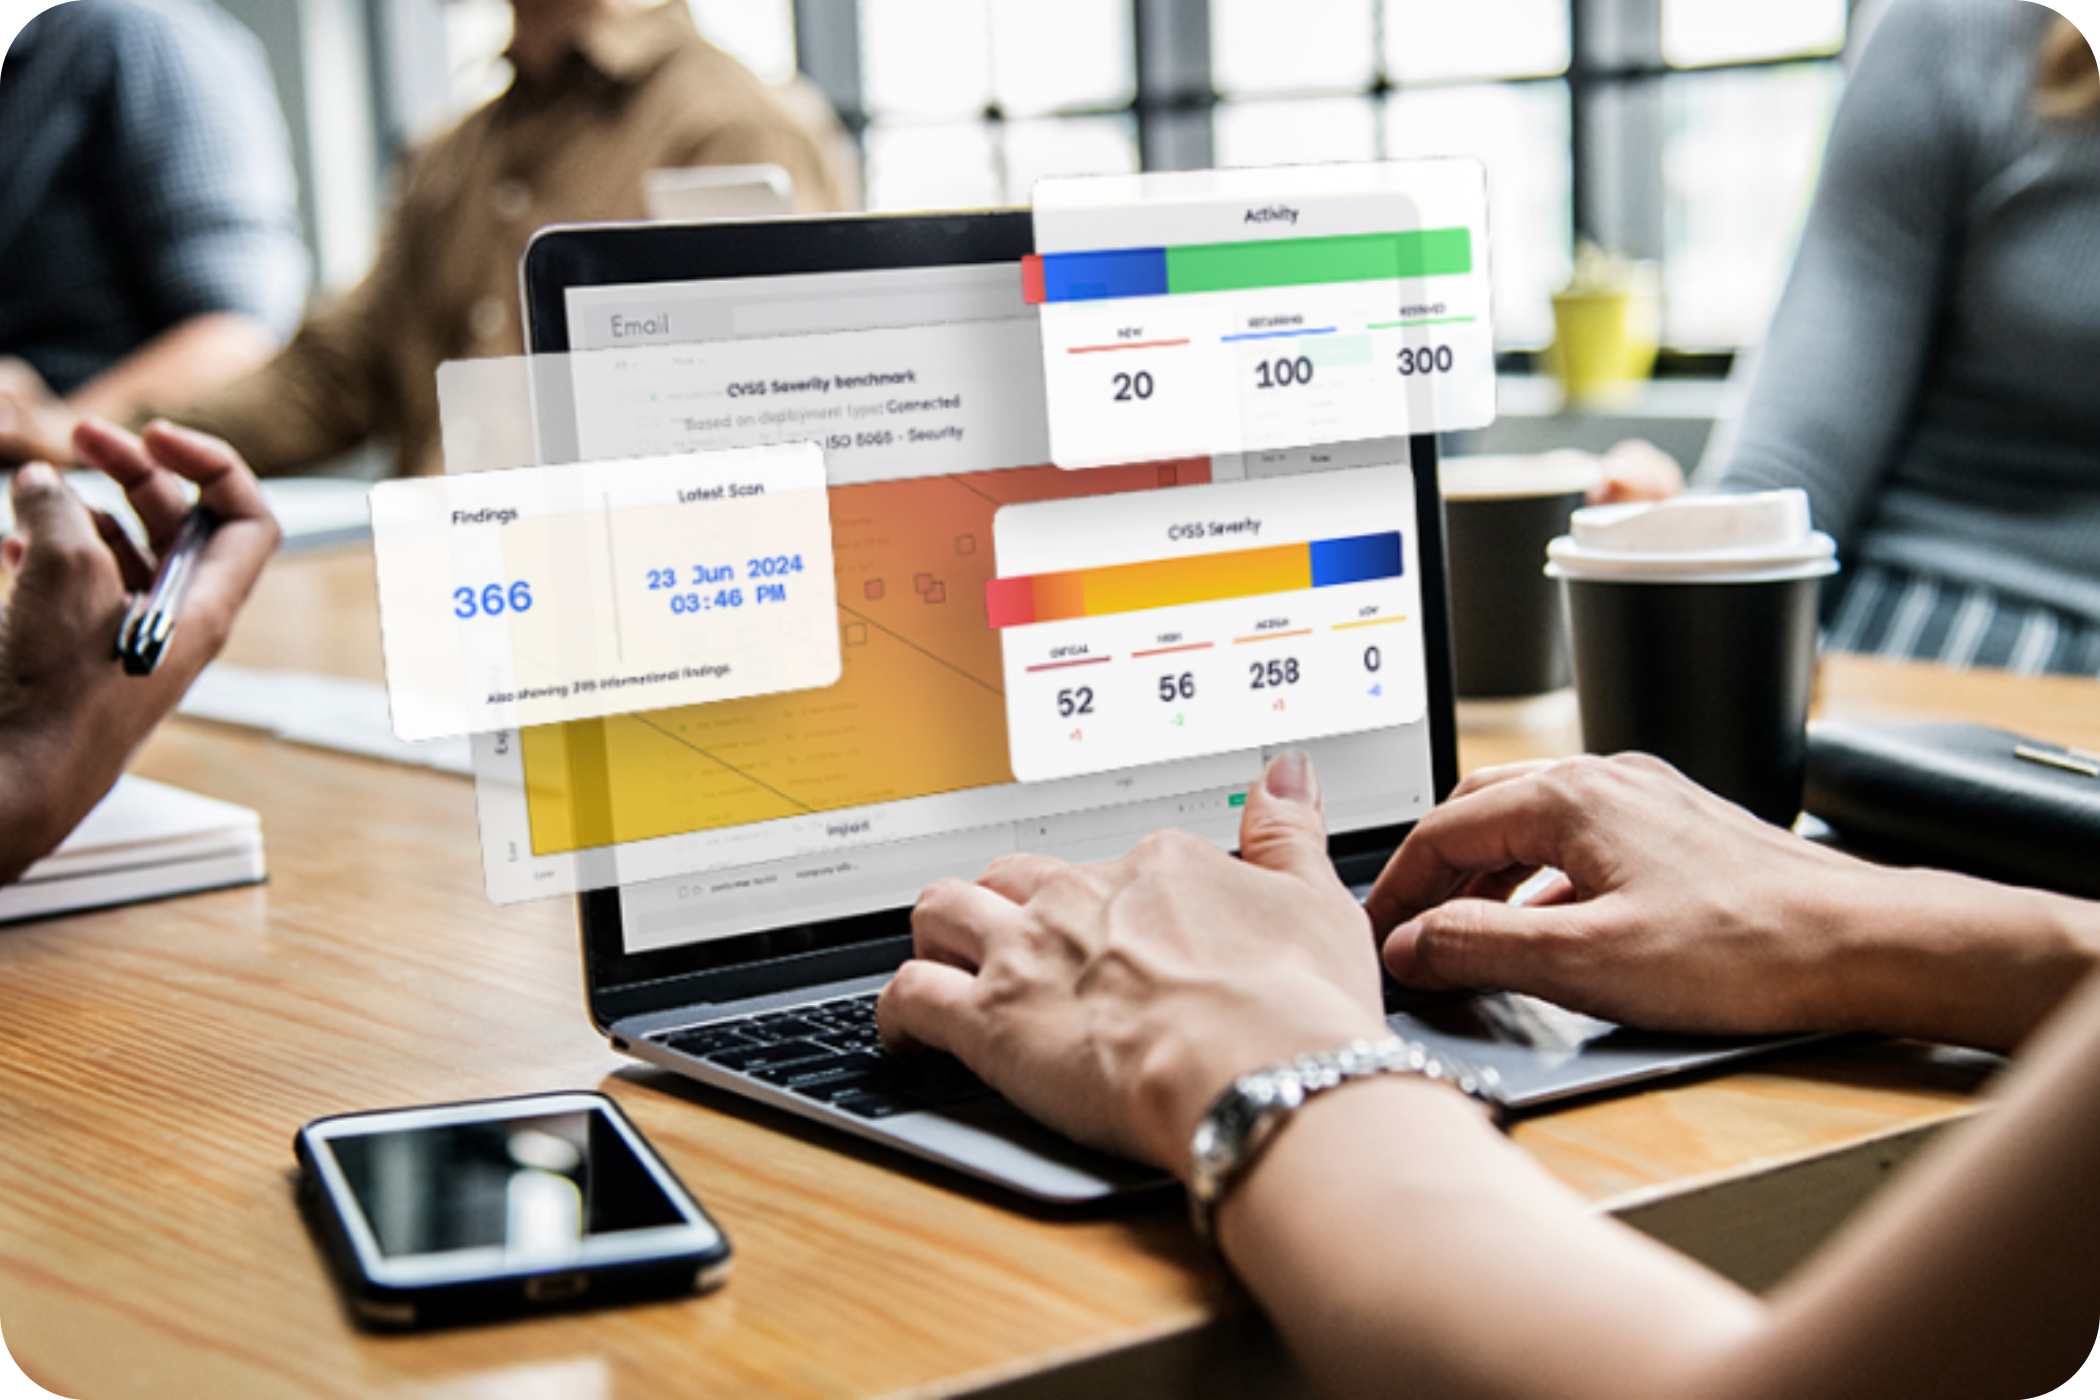
Security

Affordable IT risk assessment

Actionable insights with minimal investment—no lengthy, expensive audits required.​

A group of five colleagues in a conference room having a discussion.

Boardroom-ready roadmap

Clear, C-level-friendly reporting designed for executive buy-in and strategic decisions.​

Cut IT costs, accelerate delivery​

Reduce maintenance costs by 50% and speed up time-to-market up to 4x through tech debt reduction.
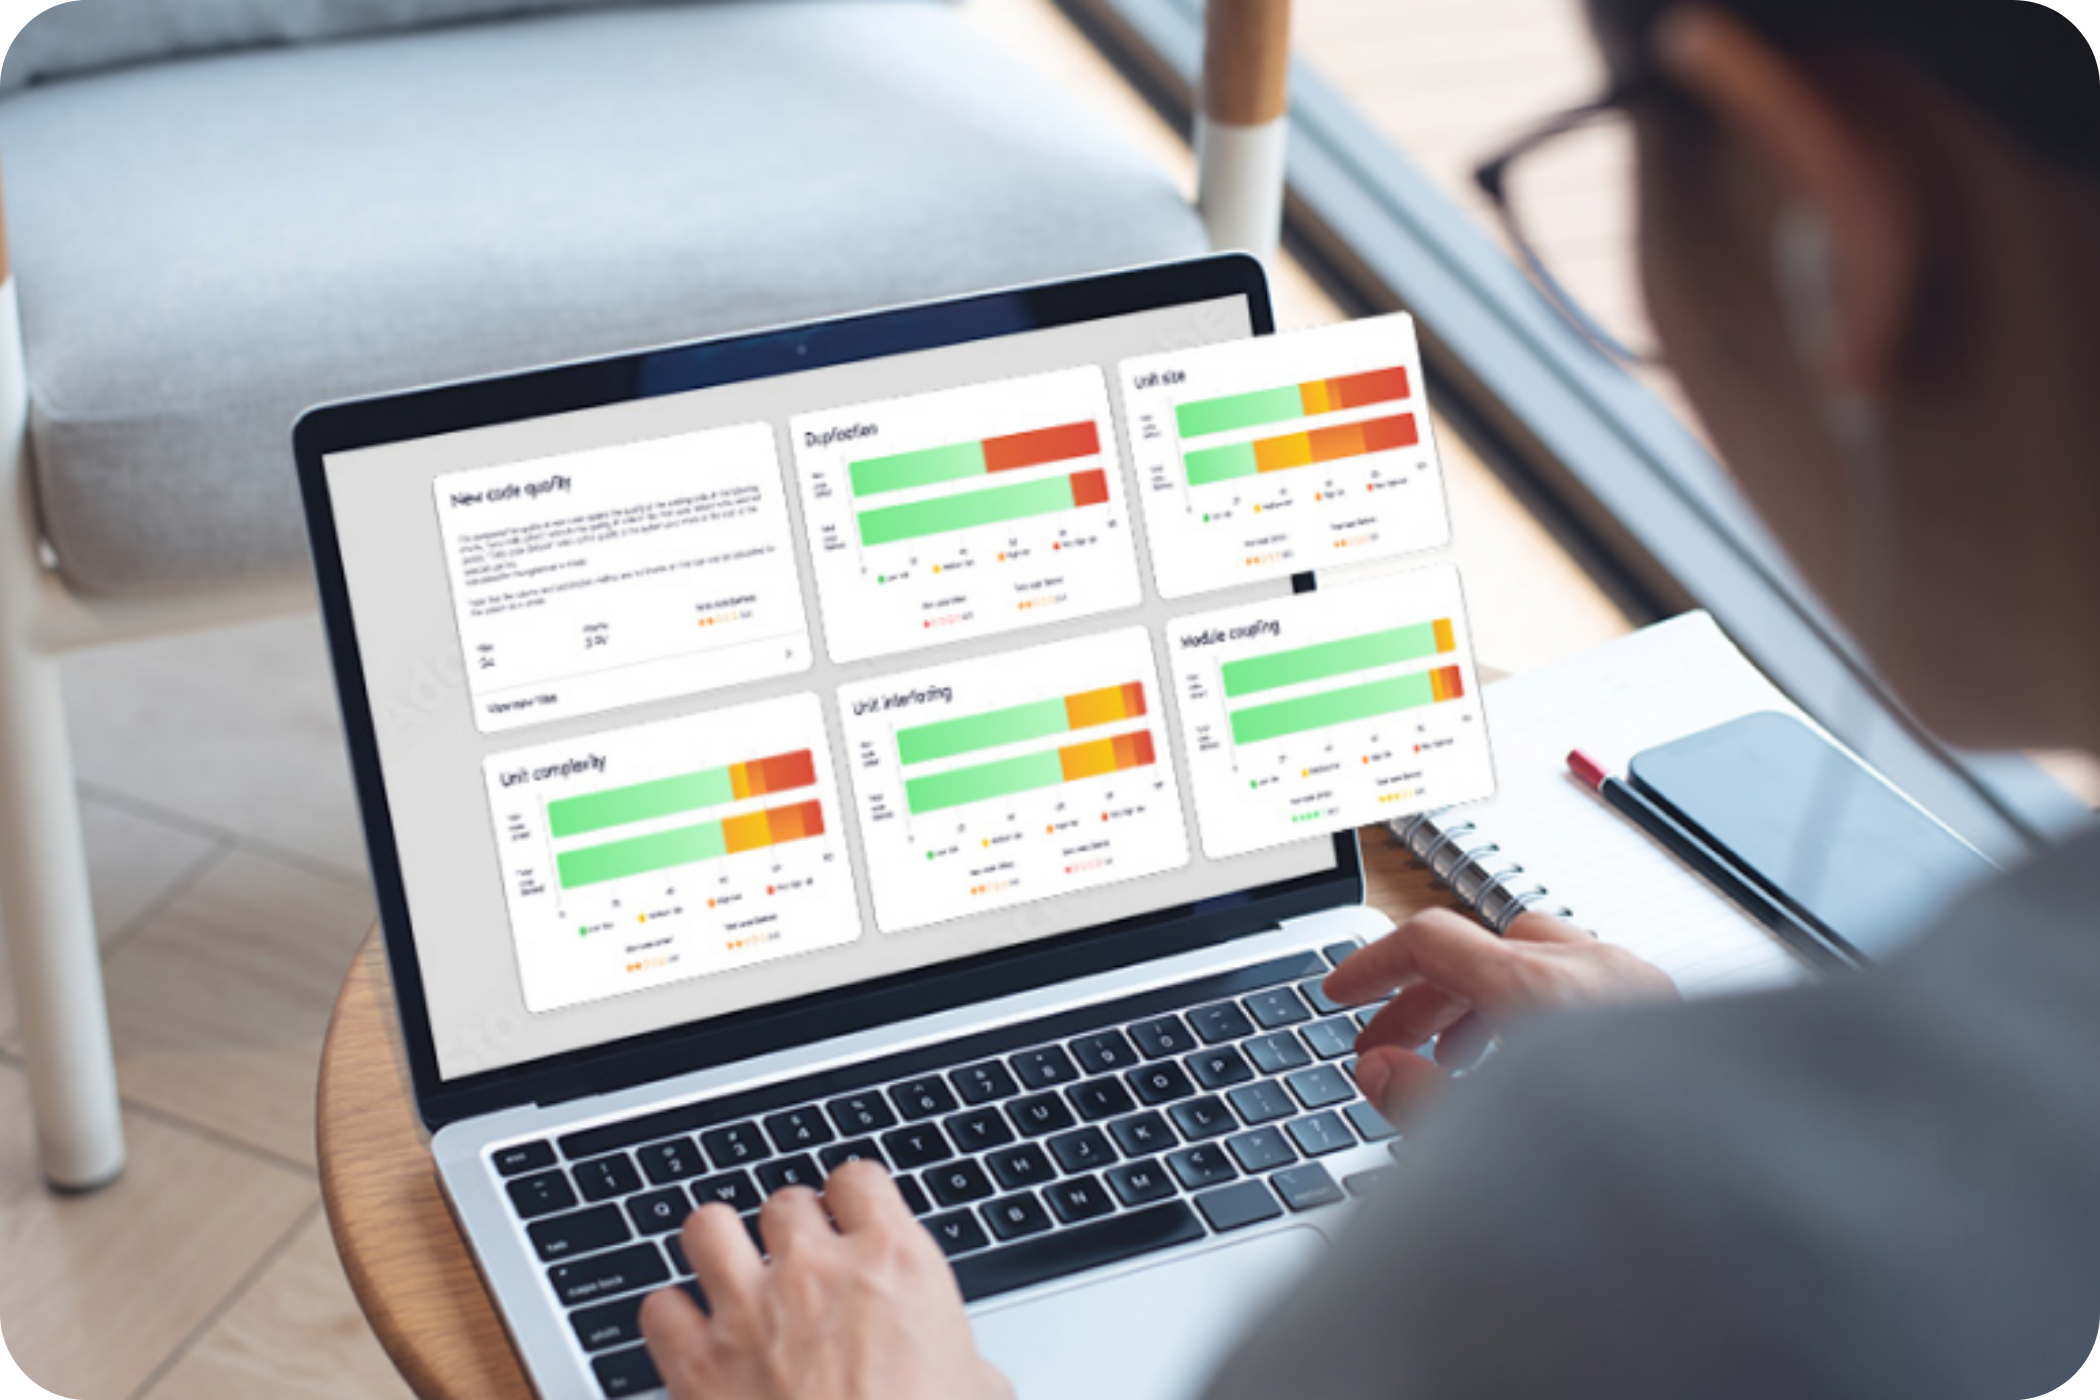
Green IT

Reduce defects, boost efficiency​

High-quality code means 15x fewer defects and 5x faster changes.

With the Software Portfolio Scan, you take the first step toward:

Yellow circles graphic

4.5X

FASTER TIME TO MARKET

Yellow circles graphic

-50%

LOWER MAINTENANCE COSTS

Yellow circles graphic

+30%

MORE DEVELOPMENT CAPACITY

Yellow circles graphic

2X

More SECURE

See how we identify red flags and hidden costs before they derail your business, in just 2 weeks.
Yellow dots representing SIG branding

Why Software Improvement Group

abstract graphic of yellow and orange lines

300+

billion lines of code analyzed, making up the biggest commercial database in the world.

Abstract design with geometric shapes and lines in blue, orange, and gray on a transparent background.

300+

technologies supported. The only technology-agnostic analysis that provides full-system insights.

Graphic of a computer and a certificate on the side

25

years of experience in software assurance for hundreds of global clients.